Product Roadmap and Implementation Success: FedEx
My Role
As a Product Operations Manager for the Route On Area Routing product, I was tasked with implementing this product in an effort to increase overall stops per hour(SPH), lower overall on-road hours, achieve a gap in full-time employee potential(FTE), and come within 1% of the budget plan variance(BPV). This initial product launch would serve as an example of product success with metrics that I committed to providing post-launch to validate those accomplishments.
Product Background
The Route On Area product was designed to assign a numeric value to a given tracking number, based on a destination address that is assigned to the tracking number. By setting geographical boundaries, I would be using this product to create a mapping and order platform and create routes. In the early stages, the product had limited capabilities that would require finding creative solutions that I would put in place to make more granular and ordered routing to achieve maximum efficiency.
My Process
I began with a problem statement of who and what was needed to be accomplished.
1. Who? I am – executive leadership
2. What? I’m trying to – implement cost-saving measures at a location level by leveraging this product – financially speaking, an aim to reduce on-road cost and on road hours by a minimum of 5%, increase stops per hour(SPH) by 3% and improve overall FTE potential within budget goal.
3. How? I need to implement this product in order to do so by a certain timeline
4. Why? Because – there must be an improvement of 5% by the end of FY
5. When? As soon as possible
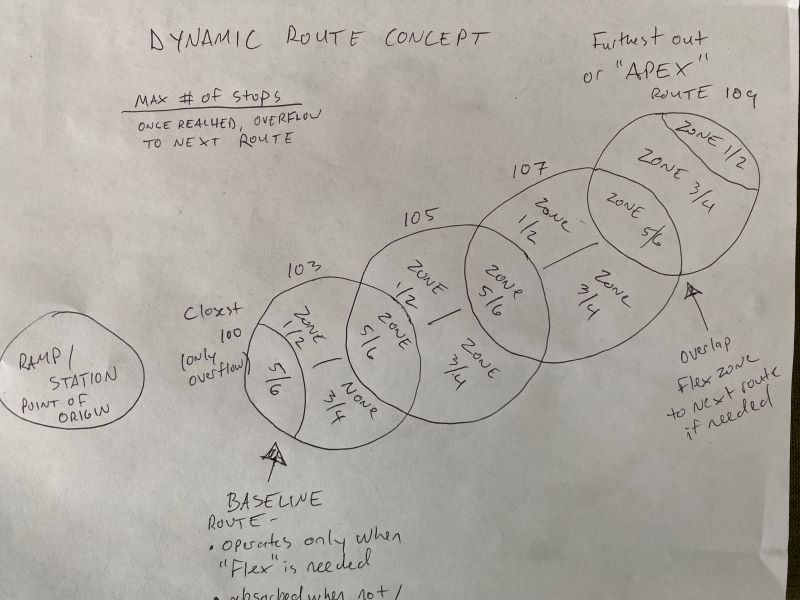
Concept – Knowing that a numerical value could be assigned to a given area, I could begin by defining what and where those given areas were. Knowing that to maximize the capabilities of this product, I would need a solution to allow for efficient zone loading of a given route that would help in minimizing manual organization time. My solution would be to create an area within a given area to work around the given limitations. Then by creating a “route within a route” of the given defined area, I was able to assign zones based on the geographical areas(the “route within a route” concept). The purpose of the zones would allow for the following:
-Zone loading of a given route’s vehicle for efficiency – zones can be assigned when routing within a defined area by using a number the same as a route. I was able to assign zones 1-6, odd to the left and even to the right, A to the front a B to the back as diagramed below.

-Defining a “drop zone” – once a route reaches full capacity, the highest assigned numeric zones would be flexed to the next route, and so on.
- Example: If “APEX route” stops >25, then zones 5/6 are flexed to the adjoining route based on their geographical proximity
I knew that once a route area was defined in the product, it could in turn also then be address ordered by taking the manifest and integrating it with a map system such as Google maps. This would begin the route at its furthest out point, marking each stop until it hits the 25 example – the last stops are then assigned to the neighboring route to maximize this route’s capacity. The closest route to the location can be cut to save on-road hours when not needed.
Next Steps
Initiation and Analysis – We have setup a test environment for the product. Knowing what it is capable of, I can review current KPIs and metrics for where we are currently, then create and test while confirming my findings could potentially equate to the success metrics detailed above.
Design and construction- First creating boundaries, using mockup for boundaries, initiate a flow from furthest to closest, with our APEX to section load. Utilizing the product to define dynamic boundaries, granular routing process, factor in to-area and from-area time, maximize stops, flex to next area – this implementation process took me some time, as boundaries and individual streets were sorted granularly and assigned via the product manually.
Testing – By using simulated data and average volume over a period of 30 days, we were able to run several simulations in a test environment. Once I confirmed my findings in this test environment, I was prepared to
Deploy into production – This required careful planning, timed starts for every employee involved, meetings to discuss roles and responsibilities, verification of the plan and setting contingencies up in the event of the unknown.
Results
Pre-implementation stops per hour(SPH) location roll-up: 6.97
Post-implementation stops per hour(SPH) location roll-up: 7.54
Overall decrease in daily on-road hours over 10% (avg 358.8 prior to 322.1)
Improvement in FTE potential within 0.05% of goal
Overall, this product proved to be a huge success and this project was one of the most interesting I have had the joy of working on to date in my career.
